Entity Mapping: Entities are useful when you do investigations as it gives you a point of reference for correlation (e.g. find all activities associated to an Account or IP address). This part of the config helps modify your query so that it maps fields together in scenarios where there is a mismatch in fieldnames between systems. The entities are stored under a new column called {entityName}CustomEntity. The drop down boxes let you select fields direct from the result of your query, which is handy if there is a 1:1 field mapping, however I’ve found that for MCAS and Azure Identity Protection alerts, this is less straight forward. In Identity Protection events, the account name is stored in ExtendedProperties, in MCAS, oddly there is no dedicated field, but rather it’s placed inside a description! So to do that you’ll need to manually edit the queries and do the mapping yourself.
An example of how I’ve done the entity mapping for the two scenarios are show below:
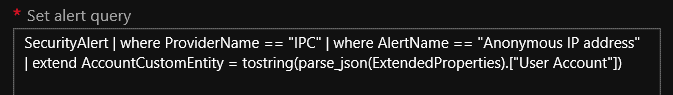

Here the value as mentioned is stored a text within a description. It’s a bit of a hack, but what we’re doing is extracting out the UPN (which is email address format) by using a regular expression.
Alert Trigger: Because this is a known event you can set the trigger as soon as it exceeds 0. The fact that ‘multiple failed attempts’ were needed to trigger this event is abstracted out because MCAS was responsible for doing that analysis.
 Alert Trigger
Since we’re looking for a single event log occurring (rather than a trend), we can have Frequency and Period be the same value (5 mins in this use case).


Once the alert is created, you’ll start seeing hits and matches in the portal and dashboard. Note that the time filter in the right will alter how many matches you’ll have.
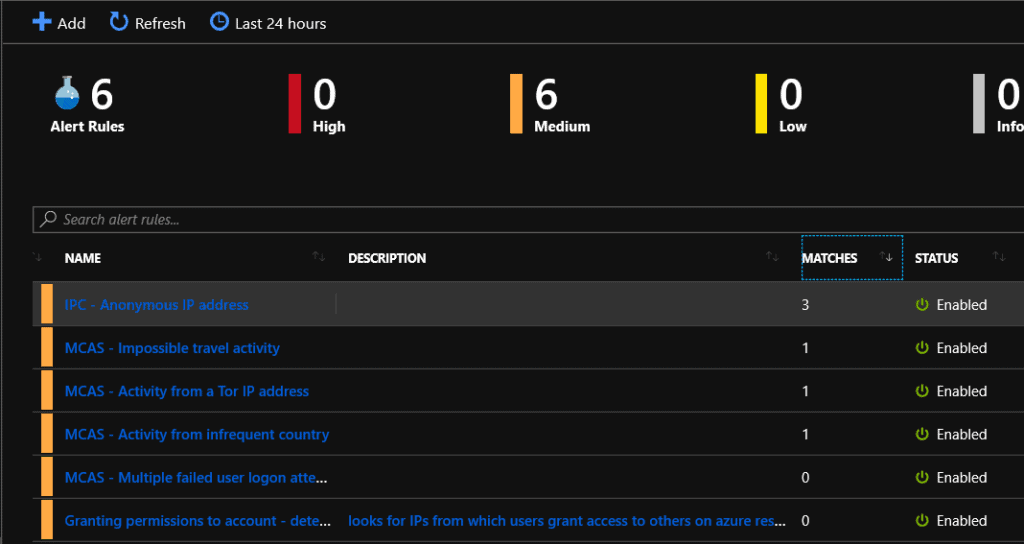 Alert Rules and Matches
The alerts themselves will then trigger Azure Sentinel to create cases for each one. Again, be aware that the time filter is used to scope and show what cases are applicable – so say an alert from 48 hours ago was triggered, creating an open case, and was not subsequently closed, if your time filter is only ‘Last 24 hours’ you won’t actually see that still open case.
Now, if you’ve done the entity mapping correctly, you’ll also start seeing the entities being picked up in the bottom. In the below example, I triggered the alert to occur on two different accounts.
 Open Cases
You can get more information around the alert that was created through View Full Details and from there under the Entities tab you can also get a view of how many alerts those entities are being associated to.
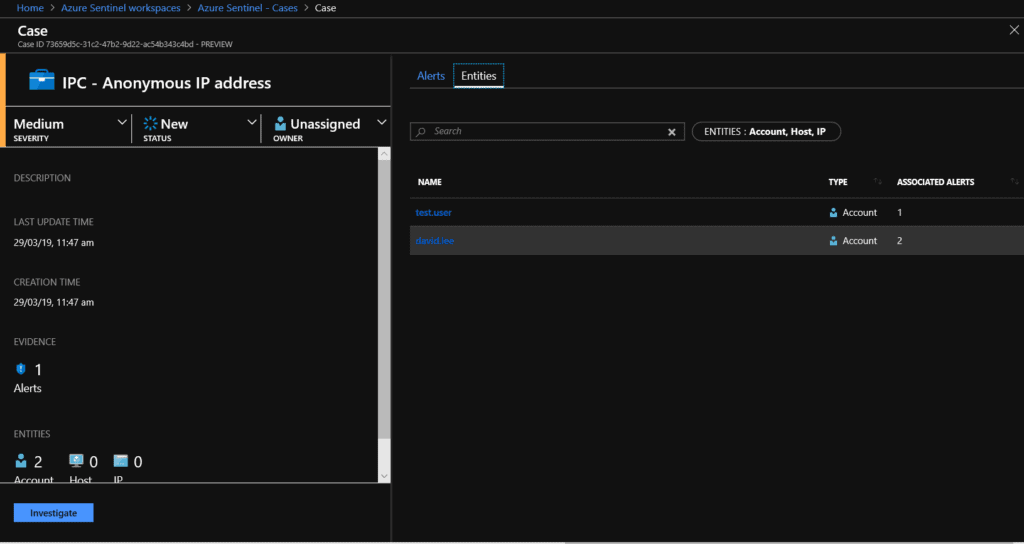 Case Details
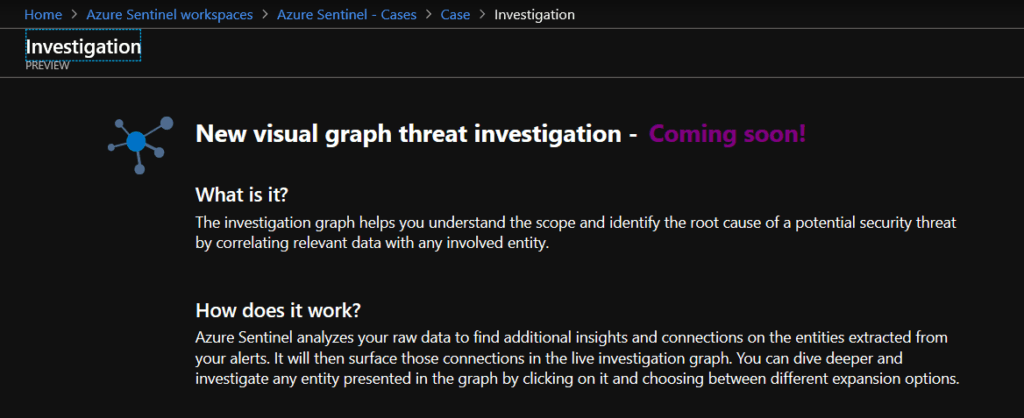
The next natural stage is to then Investigate into those cases to help diagnose what is happening. Of course, this blog post is probably a bit too cutting edge, since that feature hasn’t been turned on for my tenant yet. Once I get access, I’ll do some more deep diving into that as well. But the visual graph nature of this looks exciting!
Lastly, the most interesting part is this element of Azure Sentinel:

The enablement of FUSION to start running Microsoft’s ML models across your alerts and cases to start doing automated correlation. Again, we’re still in ‘fresh from the oven’ stage of this product, but some information around what Fusion does is described in this blog post. To paraphrase from the article, the use of ML models for automated correlation is to help admins reduce alert fatigue (which we’ve all encountered) and start surfacing cases that represent an event occurring taken from many different alerts and sources (and hence the real value of a centralised logging and SEIM service). There are examples provided in the blog post of what Fusion is capable today, such as picking up an “Anomalous login leading to O365 mailbox exfiltration” which is pretty neat. I haven’t quite managed to simulate the same behaviour myself just yet, but I suspect this is a combination of needing to get the alerts created in a certain way and also the public preview nature of the whole service.
Closing Thoughts
So this is just the first stage of our investigations into Azure Sentinel. As you can see, there are still many elements that are work in progress and I expect to see this rapidly change over the next few weeks to months. Some of the things I expect (or hope) to come along soon to make the use of Azure Sentinel much more practical for use are:
- More alert query examples in their GitHub repo. There are some there now but expect that to grow over time as the community gets involved.
- “Pre-built” alert queries being added, likely as part of the data connection onboarding process. Very similar to the old ‘SCOM Management Pack’ idea I hope (though perhaps a bit more refined)
- An API to allow for more automated creation of alert queries. Right now the only interface is the GUI, so even using the GitHub examples requires a lot of clicking and copying and pasting. Great for preview stage, but obviously not great for people like us where we might need to help many customers onboard this service.
There are also other parts of Sentinel we haven’t dived into yet, like Hunting, User Profiles and Notebooks (for custom ML models). As we investigate these we’ll provide more information in future blog posts, so stay tuned!